Get down off the fence
Continuous improvement projects don’t have to add more to one’s workload. In fact when done well, it can have the opposite effect
Stability and growth are the primary reasons any market attracts private equity buyers and a key reason many family-owned businesses flourish from one generation to the next.
The label and packaging printing segment has enjoyed stable market demand compared to other manufacturing market segments. The influx of investors plus the handoff from one generation of ownership to the next, have highlighted a lack of managerial experience through turbulent times. The changing landscape of procurement practices plus workforce availability has added new competitive forces for this current leadership group.
Demands on converters now include more inventory control capabilities and enhanced marketing capability to communicate value propositions to the customers. In recent years, converters have seen increasing pressures from workforce gaps, supplier inconsistencies, and continued increases in customer expectations.
Unlike the long economic growth cycle that drove demand in all markets, we are now faced with pre-recessionary forces. Converters in specific industrial markets are already experiencing a decline in demand that they’ve not experienced in 10 years. Inflation and increased interest rates are making borrowing for equipment purchases undesirable at a time when new equipment needs are critically high. These external factors have highlighted internal problems within companies starting with their lack of leadership experience through up and down cycles business cycles.
Many Generation-3 companies and roll-ups led by experienced financial-based leaders need more emotional intelligence to engage their best assets. This criticism is not meant to be harsh because these young leaders have not had a chance to experience turbulent times, which often force leaders into action. Economic reports indicate a real crisis is most likely afoot.
Workload
As I speak to company leaders about their hesitancy in fully committing to continuous improvement initiatives, I hear a common theme: an unwillingness to commit to a course of action is primarily because the organizations are busy with the day-to-day running of the business.
Pressing improvement projects are seen as an added workload for employees believed to be already overloaded. As we discuss a path to improvement, the leaders often see this as added work. However, I know from experience that the continuous improvement management process does not add new workloads to the organization but can provide a better work environment.
All leaders recognize that if special improvement projects are needed, they always engage the same people: the subject matter experts. In most organizations I have talked to, this is about five percent of their total population. This limits project completion and leads to islands of improvement, yielding far less improvement than possible. Because the engaged group is limited to about five percent of the company, the work piles on, leading to long lead times for completing the project.
Management systems centered on continuous improvement should engage 85 percent of the organization, thereby considerably reducing the stress and workload of the 5 percent.
But how do you get that level of engagement?
Results vs drivers
Let’s start with the metrics the organization typically reports.
Topics such as revenues (how much has shipped), EBITDA (earnings before interest taxes, depreciation and amortization), and gross margins (sales minus direct costs expressed as a percent). These types of measures are called ‘results.’
Results are essential when gauging a high-level financial performance of a company but carry little weight when explaining how each employee can impact them favorably.
A company wanting to effect change must discuss metrics relevant to the workforce that the crew can influence directly.
These metrics must first be time-based and quality based. Then add metrics for productivity. When the new metric focus definitions are appropriately understood, they drive behavior modifications. That is why we call these metrics ‘drivers.’
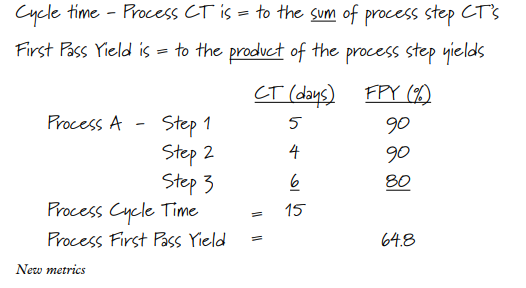
Time is easy to understand, and we measure overall cycle time by taking the time required to do one process step and adding it to the time to do the next process step, and so on. This metric is additive. When you start measuring the time required for each process step, you quickly determine where there is waiting time, rework time, or idle time impacting the process.
I recommend an organization picks the next 20 orders received and note the date and time. Follow these orders through the company from order entry through the graphics department through scheduling, production and shipping. You will quickly learn where your processes need to be improved to reduce the time required. Everyone in an organization understands the time, and everyone can impact the discussions around time. Discussions around time will cause behavior changes.
The next metric is more complicated to calculate but easy enough to understand. We are all familiar with the quality sampling of products. The driving metric for quality requires we appreciate the handoff from one process to the next is high quality.
This metric is multiplicative, meaning the quality level of one process step is multiplied by the quality level of the next process step, and so on. When results are multiplied, even a high score for each process can yield lower-than-expected performance.
The example I share is the handoff from sales to the organization to accept an order from a customer.
For the organization to process the order, the organization must know the essential requirements for production. The production floor can only proceed with the order information. Still, only some organizations understand having insufficient information or incorrect information impacts the yield of the process even if most of the data is known, for example, 90 percent. When handed to the following process performing at 90 percent, you see a process first pass yield of 81 percent. Everyone quickly recognizes that a metric focused on multiplying quality levels highlights problems rapidly. To see how your organization is doing, take the 20 orders I discussed when tracking time and follow how many go through the company processes seamlessly.
Focus on winning
The key to a successful transition of the metric discussions is to have the definitions of the metrics evident to everyone. Human behavior will drive action because most people focus on winning. When they understand how to win, a behavior change follows. Taking advantage of this phenomenon requires we link activity to the driving metrics.
When leaders begin their focus, I recommend returning to the basics of flow diagrams and value stream maps. In an organization focused on ISO Standards, this is second nature. I’m surprised to see still flow charts from top to bottom. Flow diagrams must move from left to right, like a ‘timeline.’ The timeline helps us change a reference of thinking and amplifies the need to shrink the time between process steps.
I encourage leadership teams to include the company’s subject matter experts in the dialogue and highlight process issues that impact the handoff’s time and quality. These issues are barriers to success. This activity heightens awareness to the next level of the organization and often uncovers that the executive leadership needs to be made aware of the impact on the macro business processes. Create a simple summary sheet of the barriers for later use in prioritizing future projects with estimated time savings.
Shift meetings
The frequency of the metrics review is essential. Knowing more significant problems are often an accumulation of minor issues, using a daily shift kick-off meeting provides a perfect opportunity to communicate the metrics. Many company leaders report they are already conducting daily shift start-up meetings asking about safety concerns and other administrative topics. The leadership and organizational behavior change is influenced by conversation topics that focus on cycle time and process quality making for a consistent communication process. More importantly, this becomes a universal conversation approach used in all areas of the company including the office areas.
The benefit of the meeting is that the conversation takes place around topics the employees can immediately impact. Shop floor supervisors responsible for individuals operating capital equipment such as printing presses or finishing equipment can rotate through the facility stopping at each work cell or press cell to discuss time and quality issues a couple of times per shift.
I recommend operators highlight interruptions to their equipment operation as another tracking point impacting time and quality. Support communication by creating simple metric boards at the press stations and a summary board on a central aisle to accommodate the conversation topics; by adding a simple ‘who, what, when’ to the subject, a supervisor or manager can assign simple tasks before issues lead to big problems.
We can visualize time as a critical metric to our business processes. Now imagine that timeline with zero interruptions or delays.
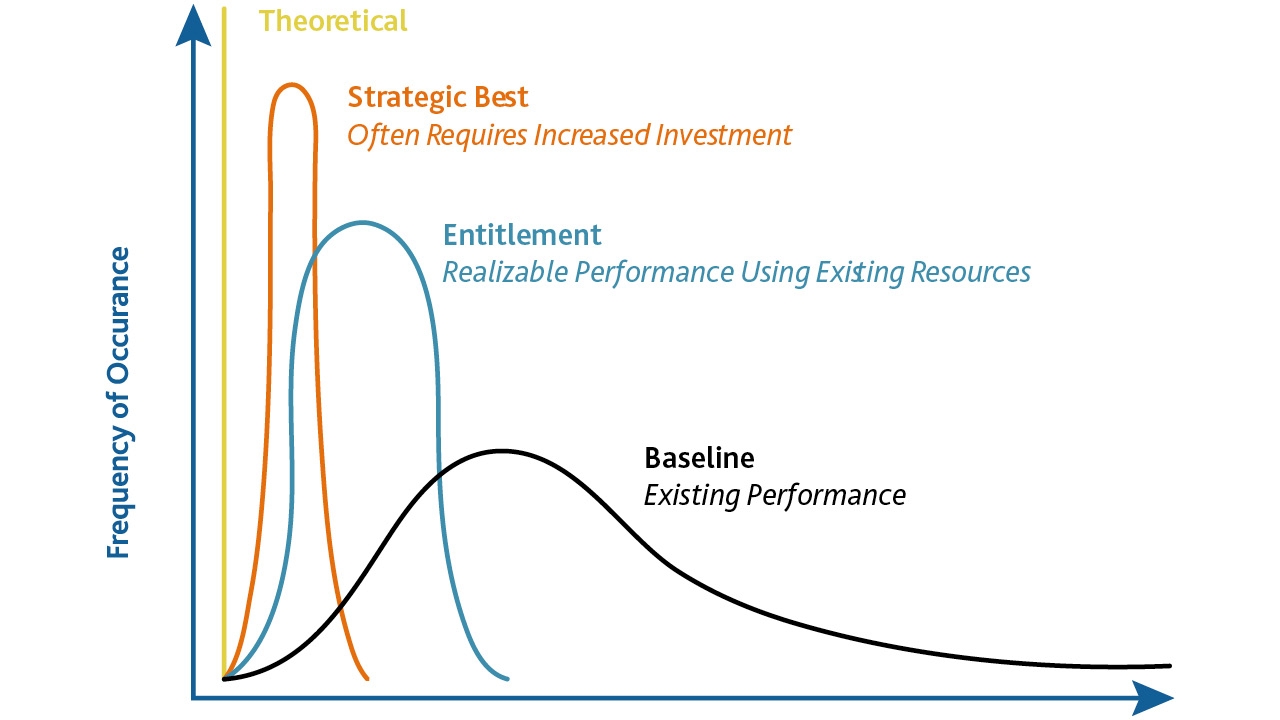
Take the same 20 orders we used as a process check; the overall actual timeline result becomes the ‘baseline’ time metric. If we remove all process delays and all process errors, the processing time becomes the theoretical best.
Many barriers to the process can be removed without investment. Eliminating barriers requires a commitment to standardizing consistent process methods for repeatability. This action leads to the process entitlement timeline.
Imagine a company’s value proposition with a 35 percent to 50 percent reduction in cycle time. With a simple focus by executive leadership, including highlighting ‘driving’ metrics and simple communication tools, the journey of continuous improvement is begun.
We can take many existing organizational activities, modify them to encourage human behavior, and increase a company’s emotional intelligence to motivate people to engage and drive results. Through this activity, we create a better value proposition for the customers and a better-performing organization that values employees.
These examples highlight not adding more work, but instead replacing the focus so that it provides a better work environment and encourages people to stay. It’s time to climb down from the fence on the side of a driving improvement with a focus on reducing process cycle time and improving process first pass yield.
Stay up to date
Subscribe to the free Label News newsletter and receive the latest content every week. We'll never share your email address.